Be a Superhuman Investor.
Behavioral science, analytics, and expert human support working together to make you a smarter, stronger investor.
Your Path to
Better Investment Decisions
You're the Captain
Markets are unpredictable but your decisions don’t have to be. Cut through the noise and take control with customized insights that keep you in control.

Increase Performance
Avoidable mistakes are your portfolio’s biggest drag. Our tools help you spot and fix them so you can grow wealth faster, with less risk.

Build confidence
Confidence shouldn’t rise and fall with your returns. Use data-backed strategies to stay sharp, disciplined, and emotionally steady through all market seasons.

The Tech
Empowers Superhuman Investors Like You
Harness Nobel Prize-winning research, AI and real-time analytics to perform above your former self and be the best investor in the room.

Your Data = Your Gold: Let’s Mine it.
Your data holds the key to better investing. We extract decision insights from your trades so you stop guessing and start evolving.
Invisible Portfolio
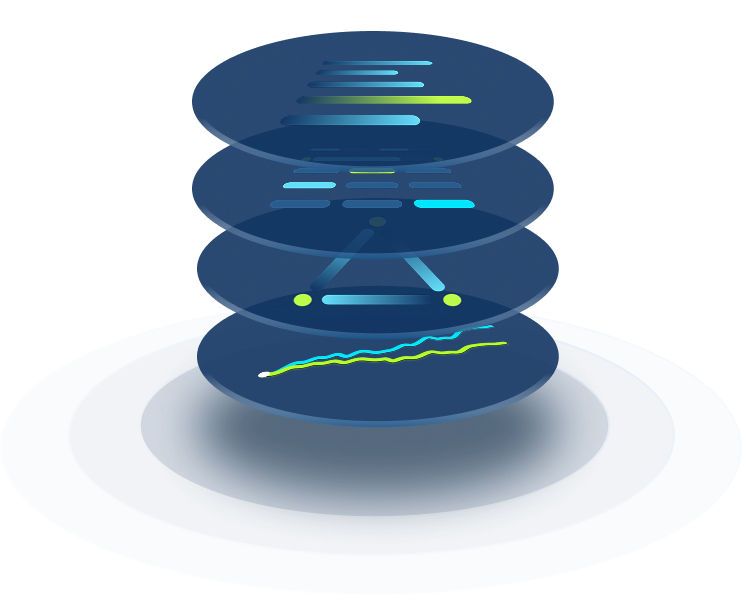
Once you sell assets they become part of your “Invisible Portfolio”—out of sign and untracked. Research shows that performance is impacted by sell decision quality, so Prof of Wall Street monitors their performance to see if they outperform the stocks you kept, helping you improve your selling decisions and refine your investment strategy.


The held portfolio (dashed line) outperforms or remains steady against the invisible portfolio (solid line), indicating smart selling decisions.
Invisible Portfolio
Once you sell assets they become part of your “Invisible Portfolio”—out of sign and untracked. Research shows that performance is impacted by sell decision quality, so Prof of Wall Street monitors their performance to see if they outperform the stocks you kept, helping you improve your selling decisions and refine your investment strategy.


The invisible portfolio (solid line) consistently outperforms the held portfolio (dashed line), indicating poor selling decisions.
Disposition Effect
Selling winners too early. Holding losers too long. These behavioral habits quietly cost investors thousands. We help you detect and correct them with insights based on your own history.


Cut losers, letting winners run: Top-performing active investors consistently allow winning stocks to increase while selectively closing losing positions. This can be you.
Dispostion Effect
Selling winners too early. Holding losers too long. These behavioral habits quietly cost investors precious performance. We help you detect and correct the Disposition Effect with insights based on your own data and empower and coach you to outperform your previous self.


Cutting flowers, watering weeds: Selling the winners that go on to outperform is (invisibly) costly, as is staying in losing positions. Detecting the financial impact helps us see our upside from overcoming the Disposition Effect.
Loss Chasing
‘Buying the dip’ can build wealth—or drain it. Our algorithms show when your strategy pays off and when it costs you, giving you a smarter way to navigate falling prices.When prices fall many investors feel compelled to buy more, but are you good at “buying the dip”, or does your portfolio bleed from “catching falling knives”? We show you how much value you create through this strategy, and provide you with detailed insights about how you can improve your performance to unlock value in portfolio management.


The portfolio (dashed line) performance is lower or relative to the invisible portfolio (solid line), indicating buying decisions of assets in losing positions is additive to performance.
Loss Chasing
‘Buying the dip’ can build wealth—or drain it. Our algorithms show when your strategy pays off and when it costs you, giving you a smarter way to navigate falling prices. When prices fall many investors feel compelled to buy more, but are you good at “buying the dip”, or does your portfolio bleed from “catching falling knives”? We show you how much value you create through this strategy, and provide you with detailed insights about how you can improve your performance to unlock value in portfolio management.


Loss Chasing: The portfolio (dashed line) performance is higher relative to the invisible portfolio (solid line), suggesting buying decisions of assets in losing positions overall detracts from portfolio performance.
Comprehensive Investor Support
You’re not alone. Our platform provides personalized diagnostics, expert coaching, and decision frameworks designed to turn investors into strategic outperformers.
Behavioral Baseline Analysis
Start by identifying patterns in your historical trading. This baseline reveals your behavioral tendencies and unlocks your unique areas for growth.

Expert Assessment
Armed with insights, meet one-on-one with a PhD behavioral expert to identify which changes will unlock real performance gains for you.

Plan to Implement Insights
With your custom plan that includes your policy statements to real-time analytics, you’ll make decisions with clarity, structure, and support.

Thesis Journal
Most investors react instead of using a repeatable decision making process that keeps their investments on the right track.
By articulating your own investment thesis, assumptions, and expectations you make your investment decisions visible and reviewable for insights. Not only does reflecting on your reasoning uncover patterns, challenge blind spots, and sharpen your long-term strategy, but you’ll see the quality of your investment decisions improve over time.
Investment Coaching
Starting from the initial baseline assessment and drafting your investment policy statement, you’ll have quarterly meetings with our team, then an annual review, to make sure you’re constantly improving and becoming the super investor you’re destined to become.

Set Up for Success
A strong foundation and deep roots allow trees to grow tall. The same is true with investing: by establishing a deep commitment and clear rules you can elevate your financial future.

Human-Technology Synergy
Technology offers computational speed, access to data, and real-time insights; tech paired with an expert coach gives you the best of both worlds and sets you up to to outperform.

Invest In Yourself and Join
The future comes much faster than you expect, so take advantage of investor-focused tools, technology, AI, coaching, insights, and supportive community to pull ahead of the pack. Join now, your best investing is waiting for you.
Testimonial
"Prof of Wall Street gave me a personalized look at how my own psychology shows up in my equities trading. It wasn’t just a report—it was a behavioral mirror that helped me understand my patterns and spot opportunities to improve. No one else is doing this kind of deep, individualized analysis."
Aaron Golden | High Net Worth Investor
FAQs
Popular questions about the Prof of Wall Street investing improvement program, answered.
If you trade intraday: our trader-specific modules are in the R&D phase, but feel free to reach out with questions.
1. Connect via API or upload your trade history (broker export or CSV)
2. Data is cleaned and standardized for analysis
3. Behavioral and performance analysis is conducted
4. The report is delivered within five business days
5. A 1:1 debrief session is scheduled with Dr. Nadler
Applying the insights may require upgrades to the investing process, such as using Prof of Wall Street's clinically-tested decision workflow, which is where the biggest, forward-looking gains can be achieved.